news
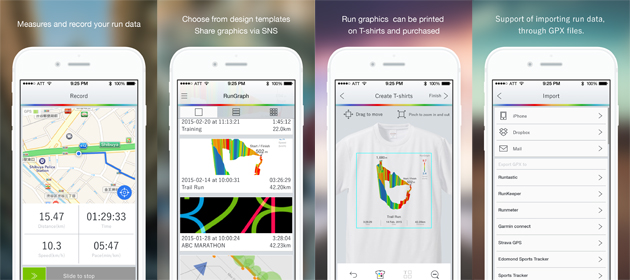
Running log data converted to infographics. The release of the iOS app “RunGraph” to make your running life more enjoyable.
WOW Inc. and Frontage Inc. (headquartered in Minato-ku, Tokyo, CEO: Toru Okada) have jointly developed the iOS app “RunGraph” for the population of approximately 10,000,000 running enthusiasts※1, cycling and motorcycle touring enthusiasts, which will visualize running log data※2 into proprietary infographics.
※1 : 2014 survey on sports life - Sasakawa Sports Foundation
※2 : Routes, distances, time, speed, pace, altitude, number of steps
With the popularization of running, the variety of running events have increased, and the diversification of involvement in running has spread, from the everyday practices of running to enjoyment of running events. But the majority of running apps have never been particularly dedicated to designing the visualization of running log data. RunGraph, by aesthetically displaying your running log data in a functional run graphic, allows you to more deeply and easily enjoy your running results. Furthermore, through the use of social media, you can share your run graphics, and boost your enjoyment of communication of data with your running and touring mates. RunGraph was created not only for the enjoyment of running and touring enthusiasts, but also to bring a more enjoyable running and touring lifestyle to event participants, organizers, and other interested parties.
App details
Release date: April 15(Wednesday) (via iTunes Store)
Price: Free
Platform: iOS 8.0 / iPhone 5 and later
▶ RunGraph Official Website